Figure 1

 TUTORIAL: INFORMATION
INTRODUCTION . DATA . RULES . CODES . UNCERTAINTY . CONTEXT
Know the Self to be sitting in the chariot, the body to be the chariot, the intellect the charioteer, and the mind the reins. The senses they call their horses, the objects of the senses their roads. -- The Hindu Upanishads
How is it that human beings are able distinguish one incoming message from another?
Begin by looking at Figure 1. What can you say about it?

"It's gray." Anything else? Interestingly, no - the figure is
uniformly the same shade of gray. Because no part of it is different than any
other part, all that can be said is, "it's gray."
![]() 3001
3001
Pause for a moment -- is this really true? (You can say things such as, "it's on this page," or "it has a green border," but those are really statements about Figure 1 and this page of the display. There's really nothing else that can be said about the contents of Figure 1 alone.)
Next, consider Figure 2.

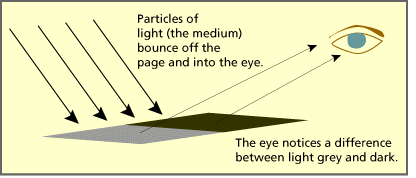
The next picture illustrates the process of "seeing grays."

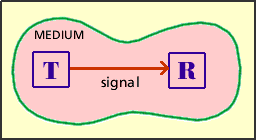
According to the fundamental Shannon/Weaver model of communication, this "seeing" corresponds to the receiver's noticing a signal in a medium. In this case, of course, the medium is light, the transmitter would be the grey diagram, and the receiver would be the person's eye.

These noticeable signals are called data.
DATA
Data is what human beings perceive directly
with their senses, and data always represent the differences that the person can discriminate among his
or her incoming signals.
For example, reconsider the "two-grays" diagram.
 Because viewers notice differences in the data that they receive, they become able to make definitive statements about the image. They can
identify left (the light side) and right (the dark side). They can locate the
boundary between the two sides. They can say that the two sides are about the
same size, and so on. These statements represent information that the viewers have created from the data that they received. In other words, as a person is able to explain how this particular image is unique and different from other possible images, the person is said to be more informed about this image.
Next consider Figure 3. How does this figure differ from Figures 1 and 2?

Notice that the viewer can still define "left and right," "light and dark," the ideas of "boundary" and "area" and so on. However, something else has been added -- the "stripes" of lighter colored gray appear to be arranged in a regular, predictable way from the "top, left" to the "bottom, right." This predictable, repeated occurrence of data is called a pattern.
Next consider Figure 4. How does its pattern differ from the pattern of Figure 3?

While the pattern in Figure 4 does appear to be regular and
predictable, it is more difficult to describe. Figure 3 is
"...a background of dark gray overlaid by light gray diagonal lines approximately two inches
apart." But what statement would accurately describe the pattern of Figure
4?
![]() 1036
1036
![]() 3002
3002
![]() 3003
3003
![]() 3021
3021
![]() 3022
3022
This observation - that some patterns are more easily described than others - leads to the creation of two more terms: simple, for easily described patterns, and complex, for patterns that are difficult to describe. And it further leads to the invention of the kind of statement that is called a rule. Rules are explained in the next section of this tutorial.